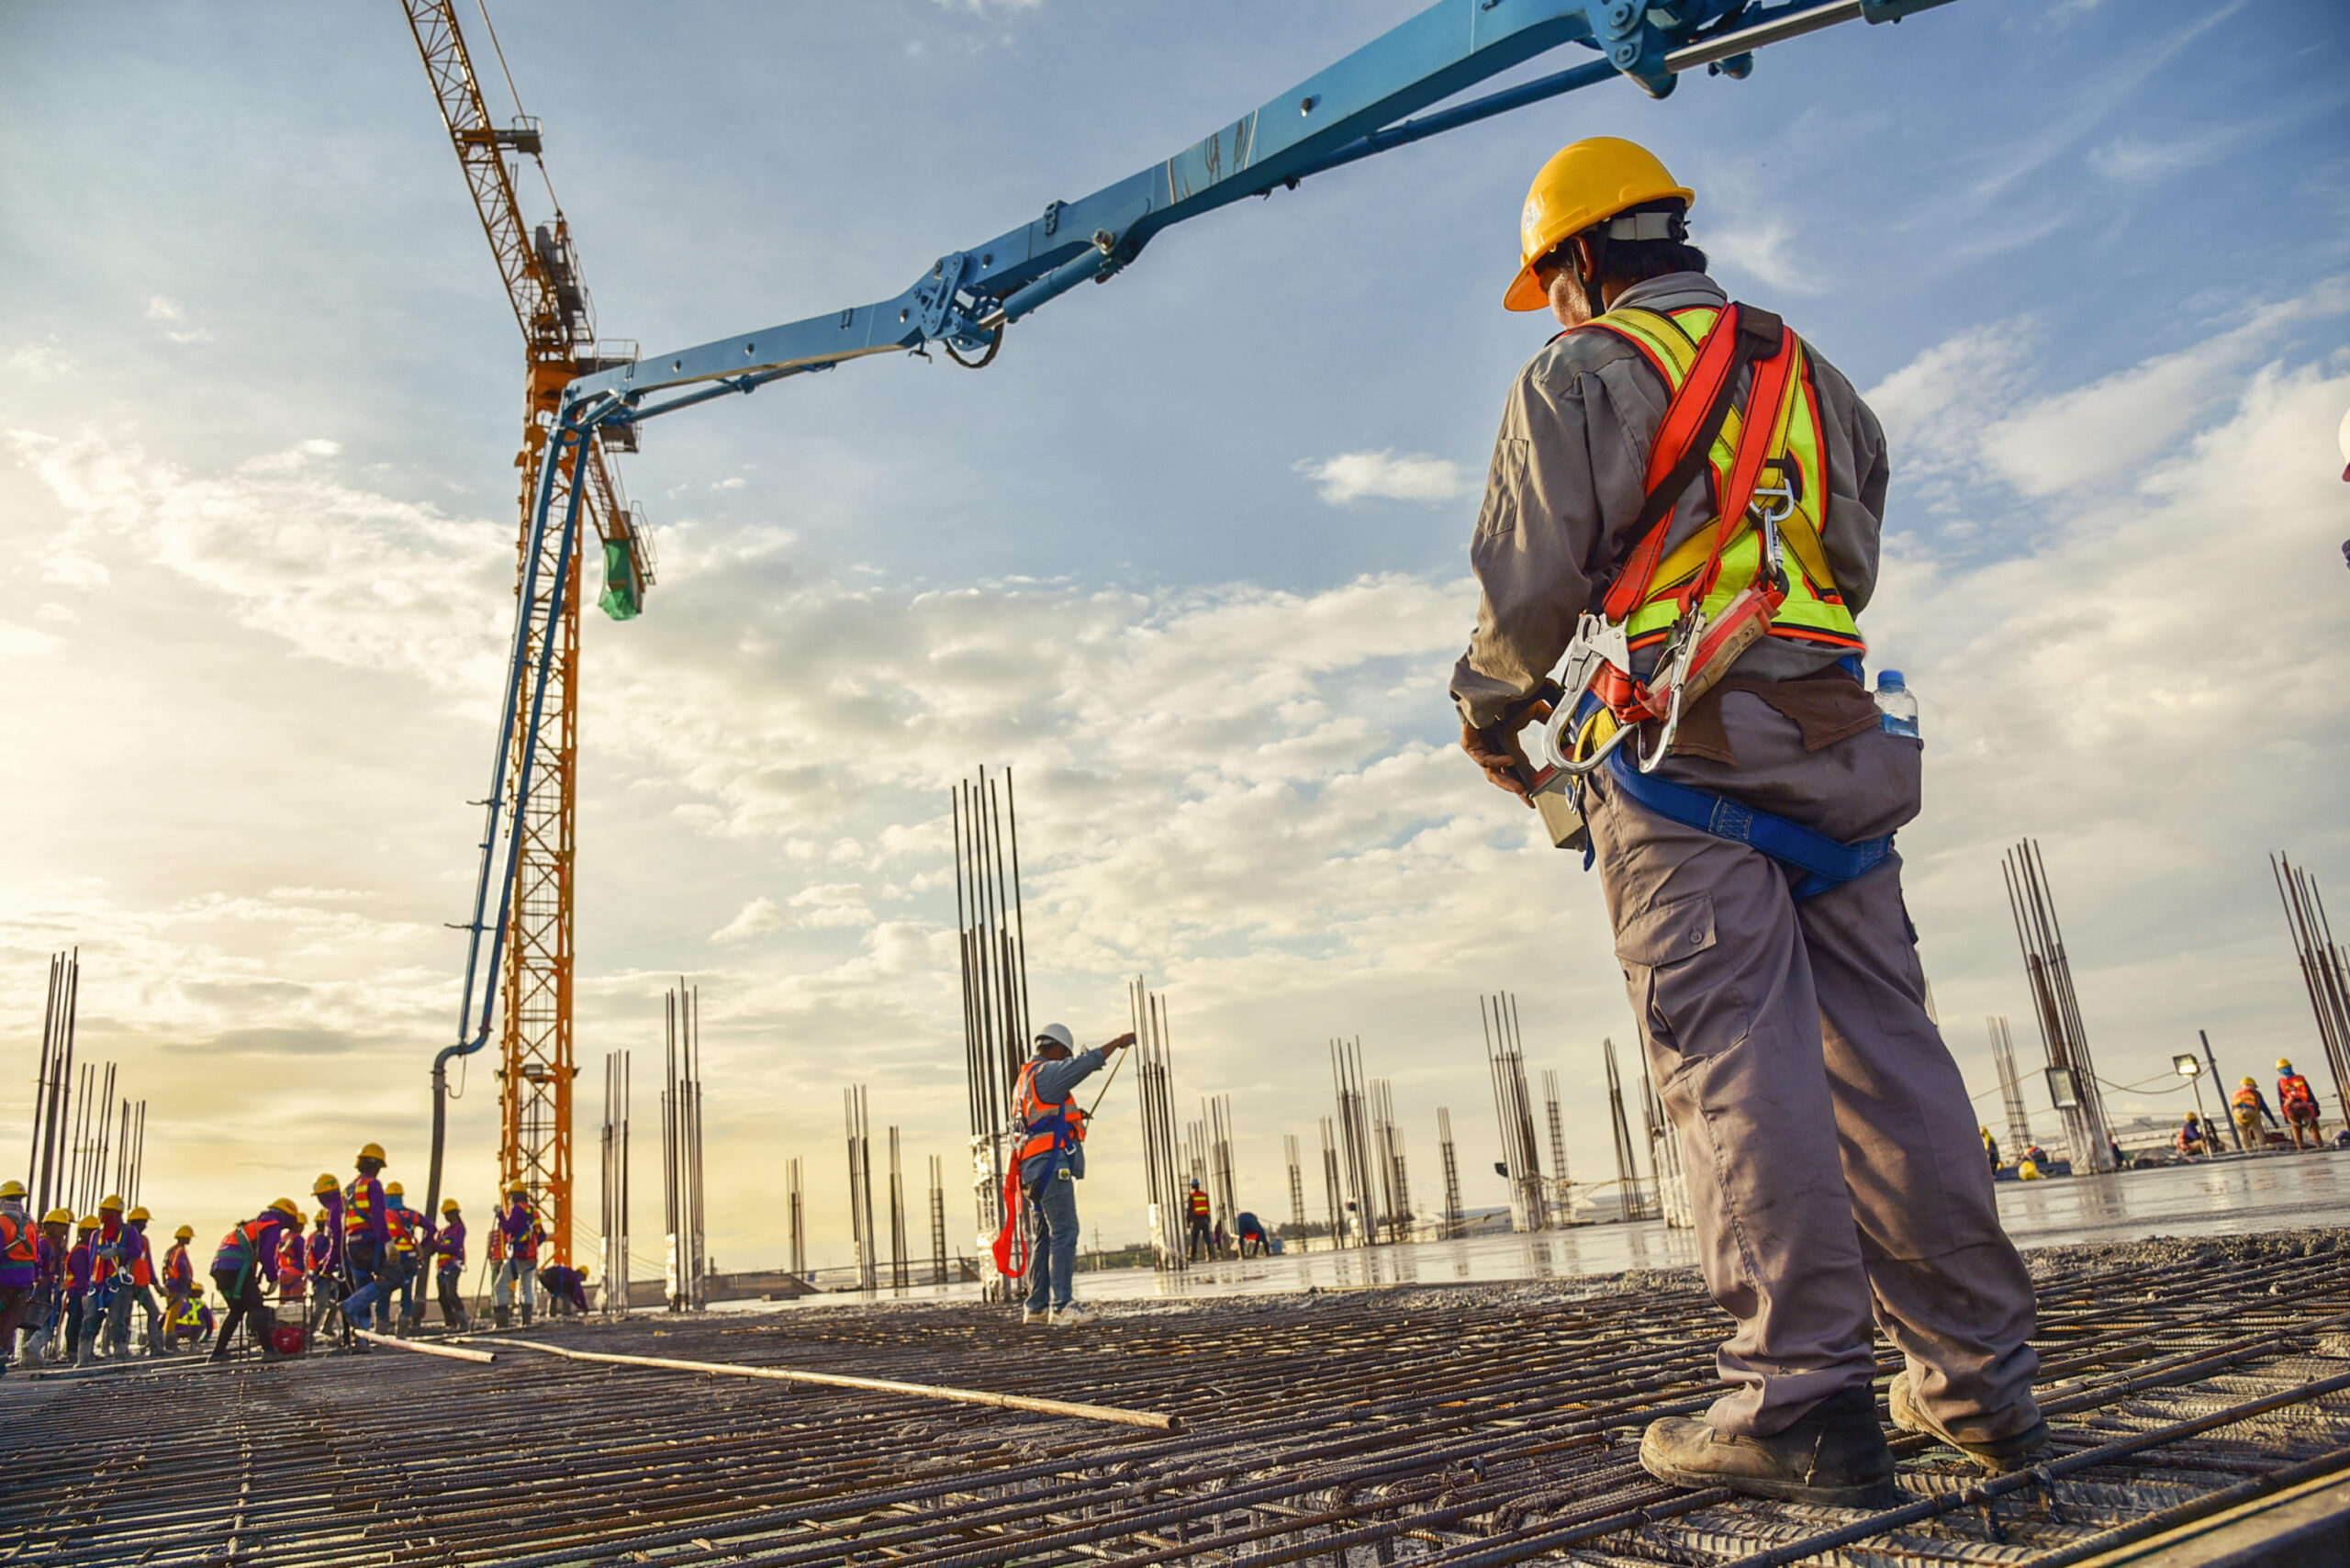
Good news. In 2020, the number of fatal occupational injuries in the construction industry has decreased. The death toll of construction workers in 2020 was 1,008, down 5.3% from 1,061 work-related deaths in 2019.
So, the bad news is that the construction industry has once again topped all industries in total fatal work injuries. According to the Census of Fatal Occupational Injuries , the construction industry accounted for 23% of all private sector worker deaths in 2020.
More bad news. The fatal injury rate in the construction industry was 10.2 in 2020, up from 9.7 in 2019. For all workers, the fatal injury rate dropped from 3.5 in 2019 to 3.4 in 2020. The fatal injury rate is calculated as the number of fatal occupational injuries. per 100,000 full-time equivalent (FTE) workers.
Although it accounts for the highest number of worker deaths, the construction industry only ranks fourth in terms of fatalities of any industry. Agriculture, forestry, fishing and hunting had a fatal injury rate of 21.5, followed by transport and warehousing at 13.4 and mining, quarrying and oil and gas extraction at 10.5. With the exception of construction, all of these industries saw a decline in injury deaths in 2020.
The number of non-fatal injuries and illnesses in the construction industry has dropped from 200,100 in 2019 to 174,100 in 2020. The incidence rate for non-fatal injuries and illnesses also dropped from 2.8 in 2019 to 2.5 in 2020, according to a survey by the US Bureau of Labor Statistics. Data on occupational injuries and diseases .
Events leading to construction deaths in 2020
Of the 1,008 construction worker deaths in 2020, 368 were due to falls, trips or trips, 247 were due to vehicle injuries, 174 were due to exposure to harmful substances or the environment, and 153 were due to contact with a facility or equipment.
Another 55 construction workers died as a result of violence or other injuries from people or animals, and 9 as a result of fires and explosions.
Construction jobs with the most fatalities in 2020
The top 10 occupations that led to fatal injuries in the construction industry in 2020 were:
- Construction workers – 308 deaths (293 in 2019)
- Supervisors of construction and mining workers - 88 deaths (136 in 2019)
- Roofers – 88 deaths (111 in 2019)
- Carpenters - 79 deaths (99 in 2019)
- Electricians - 70 deaths (68 in 2019)
- Construction equipment operators – 65 deaths (62 in 2019)
- Painters and upholsterers - 53 deaths (42 in 2019)
- Pipelayers, plumbers, pipe fitters and steam fitters - 30 deaths (40 in 2019)
- Assistants, construction professions - 19 deaths (20 in 2019)
- Iron and steel workers - 16 deaths (18 in 2019)
Roofers had one of the highest fatal occupational injury rates for any occupation in any industry, at 47.0. In 2020, the number of construction assistant workers was 43.3, while workers in the iron and steel industry had a fatal work injury rate of 32.5.
Construction non-fatal injuries and illnesses in 2020
Of the 174,100 reported injuries and illnesses received by construction industry workers in 2020, 43% of them are related to absence from work days.
Those 74,500 injuries and illnesses that required days away from work were the result of 20,640 sprains, strains, and ruptures; 14,190 cases of soreness or pain; 9840 cuts, lacerations and punctures; and 9710 fractures.
The average number of days away from work following an injury or illness at a construction site was 11 in 2020, compared to 13 days in 2019. Of the 74,500 missed work day accidents, 9,820 involved just one day off work. .
About 30% of construction accidents required an absence from work of 31 days or more, for a total of 22,620 people. This number is down from 27,190 in 2019, representing 34% of all non-fatal accidents or injuries in construction requiring several days off work.
Events leading to non-fatal injuries and illnesses in construction
In the construction industry, contact with an object or equipment was the leading event for multi-day work-related non-fatal injuries in 22,470 people. Falls, slips and trips followed, accounting for 21,510 injuries. About half of those falls, 10,790, were falls to a lower level. Overexertion and bodily reaction caused 18,980 injuries, and 6,580 as a result of exposure to harmful substances or the environment.
In 2020, traffic accidents caused 3,310 non-fatal injuries among construction workers. 700 injuries were caused by violence and other injuries from people or animals. Of these, 680 involved incidents involving animals or insects. In 2020, 230 construction workers were affected by fires and explosions.
Occupations with the most non-fatal injuries in 2020
The top ten occupations that resulted in injury or illness while away from work in the construction industry were:
- Builders – 16,590 (19,790 in 2019)
- Carpenters - 11,960 (11,670 in 2019)
- Electricians - 7270 (7400 in 2019)
- Pipelayers, plumbers, pipe fitters and steam fitters - 6520 (6330 in 2019)
- Supervisors of construction and mining workers - 5090 (5130 in 2019)
- Construction equipment operators - 2780 (3630 in 2019)
- Drywall Installers, Ceiling Tile Installers and Cone Installers 2220 (1490 in 2019)
- Roofers - 1960 (3850 in 2019)
- Construction Assistants - 1990 (2770 in 2019)
- Painters and upholsterers - 1640 (2730 in 2019)
Workers must know how to do their job safely and have the proper safety and personal protective equipment. The rules and standards set by OSHA are the bare minimum that employers must follow to ensure that every worker can safely return home at the end of each shift.

Excelente articulo
ReplyDeleteNic
ReplyDeleteNice job
ReplyDelete